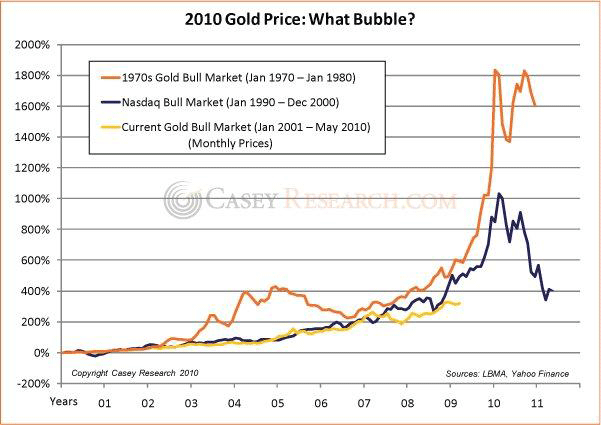
Best things to own are a good manged futures hedge fund and precious metals – like gold! For the ideal fund contact Banner info@bannerjapan.com . . .
50 most underreported facts about the state of the US economy
As we close on another week replete with ugly economic data and the usual bizarro counterintuitive market, here is a summary of the 50 most underreported facts about the state of the US economy, courtesy of the Coto report.
#50) In 2010 the U.S. government is projected to issue almost as much new debt as the rest of the governments of the world combined.
#49) It is being projected that the U.S. government will have a budget deficit of approximately 1.6 trillion dollars in 2010.
#48) If you went out and spent one dollar every single second, it would take you more than 31,000 years to spend a trillion dollars.
#47) In fact, if you spent one million dollars every single day since the birth of Christ, you still would not have spent one trillion dollars by now.
#46) Total U.S. government debt is now up to 90 percent of gross domestic product.
#45) Total credit market debt in the United States, including government, corporate and personal debt, has reached 360 percent of GDP.
#44) U.S. corporate income tax receipts were down 55% (to $138 billion) for the year ending September 30th, 2009.
#43) There are now 8 counties in the state of California that have unemployment rates of over 20 percent.
#42) In the area around Sacramento, California there is one closed business for every six that are still open.
#41) In February, there were 5.5 unemployed Americans for every job opening.
#40) According to a Pew Research Center study, approximately 37% of all Americans between the ages of 18 and 29 have either been unemployed or underemployed at some point during the recession.
#39) More than 40% of those employed in the United States are now working in low-wage service jobs.
#38) According to one new survey, 24% of American workers say that they have postponed their planned retirement age in the past year.
#37) Over 1.4 million Americans filed for personal bankruptcy in 2009, which represented a 32 percent increase over 2008. Not only that, more Americans filed for bankruptcy in March 2010 than during any month since U.S. bankruptcy law was tightened in October 2005.
#36) Mortgage purchase applications in the United States are down nearly 40 percent from a month ago to their lowest level since April of 1997.
#35) RealtyTrac has announced that foreclosure filings in the U.S. established an all time record for the second consecutive year in 2009.
#34) According to RealtyTrac, foreclosure filings were reported on 367,056 properties in March 2010, an increase of nearly 19 percent from February, an increase of nearly 8 percent from March 2009 and the highest monthly total since RealtyTrac began issuing its report in January 2005.
#33) In Pinellas and Pasco counties, which include St. Petersburg, Florida and the suburbs to the north, there are 34,000 open foreclosure cases. Ten years ago, there were only about 4,000.
#32) In California’s Central Valley, 1 out of every 16 homes is in some phase of foreclosure.
#31) The Mortgage Bankers Association recently announced that more than 10 percent of all U.S. homeowners with a mortgage had missed at least one payment during the January to March time period. That was a record high and up from 9.1 percent a year ago.
#30) U.S. banks repossessed nearly 258,000 homes nationwide in the first quarter of 2010, a 35 percent jump from the first quarter of 2009.
#29) For the first time in U.S. history, banks own a greater share of residential housing net worth in the United States than all individual Americans put together.
#28) More than 24% of all homes with mortgages in the United States were underwater as of the end of 2009.
#27) U.S. commercial property values are down approximately 40 percent since 2007 and currently 18 percent of all office space in the United States is sitting vacant.
#26) Defaults on apartment building mortgages held by U.S. banks climbed to a record 4.6 percent in the first quarter of 2010. That was almost twice the level of a year earlier.
#25) In 2009, U.S. banks posted their sharpest decline in private lending since 1942.
#24) New York state has delayed paying bills totalling $2.5 billion as a short-term way of staying solvent but officials are warning that its cash crunch could soon get even worse.
#23) To make up for a projected 2010 budget shortfall of $280 million, Detroit issued $250 million of 20-year municipal notes in March. The bond issuance followed on the heels of a warning from Detroit officials that if its financial state didn’t improve, it could be forced to declare bankruptcy.
#22) The National League of Cities says that municipal governments will probably come up between $56 billion and $83 billion short between now and 2012.
#21) Half a dozen cash-poor U.S. states have announced that they are delaying their tax refund checks.
#20) Two university professors recently calculated that the combined unfunded pension liability for all 50 U.S. states is 3.2 trillion dollars.
#19) According to EconomicPolicyJournal.com, 32 U.S. states have already run out of funds to make unemployment benefit payments and so the federal government has been supplying these states with funds so that they can make their payments to the unemployed.
#18) This most recession has erased 8 million private sector jobs in the United States.
#17) Paychecks from private business shrank to their smallest share of personal income in U.S. history during the first quarter of 2010.
#16) U.S. government-provided benefits (including Social Security, unemployment insurance, food stamps and other programs) rose to a record high during the first three months of 2010.
#15) 39.68 million Americans are now on food stamps, which represents a new all-time record. But things look like they are going to get even worse. The U.S. Department of Agriculture is forecasting that enrollment in the food stamp program will exceed 43 million Americans in 2011.
#14) Phoenix, Arizona features an astounding annual car theft rate of 57,000 vehicles and has become the new “Car Theft Capital of the World”.
#13) U.S. law enforcement authorities claim that there are now over 1 million members of criminal gangs inside the country. These 1 million gang members are responsible for up to 80% of the crimes committed in the United States each year.
#12) The U.S. health care system was already facing a shortage of approximately 150,000 doctors in the next decade or so, but thanks to the health care “reform” bill passed by Congress, that number could swell by several hundred thousand more.
#11) According to an analysis by the Congressional Joint Committee on Taxation the health care “reform” bill will generate $409.2 billion in additional taxes on the American people by 2019.
#10) The Dow Jones Industrial Average just experienced the worst May it has seen since 1940.
#9) In 1950, the ratio of the average executive’s paycheck to the average worker’s paycheck was about 30 to 1. Since the year 2000, that ratio has exploded to between 300 to 500 to one.
#8) Approximately 40% of all retail spending currently comes from the 20% of American households that have the highest incomes.
#7) According to economists Thomas Piketty and Emmanuel Saez, two-thirds of income increases in the U.S. between 2002 and 2007 went to the wealthiest 1% of all Americans.
#6) The bottom 40 percent of income earners in the United States now collectively own less than 1 percent of the nation’s wealth.
#5) If you only make the minimum payment each and every time, a $6,000 credit card bill can end up costing you over $30,000 (depending on the interest rate).
#4) According to a new report based on U.S. Census Bureau data, only 26 percent of American teens between the ages of 16 and 19 had jobs in late 2009 which represents a record low since statistics began to be kept back in 1948.
#3) According to a National Foundation for Credit Counseling survey, only 58% of those in “Generation Y” pay their monthly bills on time.
#2) During the first quarter of 2010, the total number of loans that are at least three months past due in the United States increased for the 16th consecutive quarter.
#1) According to the Tax Foundation’s Microsimulation Model, to erase the 2010 U.S. budget deficit, the U.S. Congress would have to multiply each tax rate by 2.4. Thus, the 10 percent rate would be 24 percent, the 15 percent rate would be 36 percent, and the 35 percent rate would have to be 85 percent.
Finance in Focus: July 2010
There is an old saying on Wall Street that the market is driven by just two emotions: FEAR and GREED. Although this is an oversimplification, it can often be true. Succumbing to these emotions can have a profound and detrimental effect on investors’ portfolios and stock markets worldwide.
Warren Buffet is a great example of how to avoid these two emotions in our investing decisions and has two great quotes regarding this topic that I think are very appropriate, given our current market conditions.
The first quote goes like this: “Unless you can watch your stock holdings decline by 50% without becoming panic-stricken, you should not be in the stock market.”
And the second one:“We simply attempt to be fearful when others are greedy and to be greedy only when others are fearful.”
Deflation Next?
One of the concerns of both the financial markets and the Fed is the prospect for near term deflation in the economy. Deflation can occur when consumers begin to forgo current consumption due to their expectation that prices will fall in the future. This in turn can lead to lower investment by companies that refuse to commit capital to their businesses because of their expectation of a low rate of return due to lower prices. This creates a vicious cycle of both falling consumption and falling investment known as the “deflationary spiral.” This cycle can become very difficult to break out of once it takes hold, as evidenced by Japan in the ‘90s. The Fed clearly understands this and the potential downside risks of deflation. In addition, the market will begin to look for signs of deflation and will anticipate steps that the Fed will need to take in order to prevent it. This, we believe, is one of the reasons why the U.S. Treasury market has rallied so strongly and will continue to do so in the near term. While the initial move in May could be attributed to a short term flight to quality, the most recent move lower in yields appears more long term in nature. One explanation for this is that the market is becoming aware that the economy may be entering a deflationary spiral and that the Fed may move long term rates lower through additional Quantitative Easing (“QE”). Since short term rates are already hovering near zero, QE is one of the few mechanisms left that will allow the Fed to provide further monetary stimulus.
Global Warming
NASA has found that methane is 33 times more potent than carbon dioxide in causing global warming.
Many scientists have said that methane releases have caused past warming spells. See this, this, this, this and this. Indeed, methane has such a powerful effect on climate that scientists believe that woolly mammoth farts gaseous emissions are responsible for warming the Earth 13,000 years ago.
Guess what is streaming into the Gulf of Mexico along with the OIL. . . Tremendous quantities of methane are being emitted by the Gulf oil spill. The methane could kill all life in large areas of the Gulf. However, rumors being spread widely around the Web claiming that the methane could bring on a doomsday catastrophe are not credible.
Yet . . only time will tell.
 if you have Yen sitting in the bank, it is time to move and take advantage of the current exchange rate . . . call 03 5724 5100 we can help.
The market in quick format:
Gold ETF GLD – Daily Chart
Gold has formed a large cup & handle pattern. It has held up well during the recent weakness.
But zooming into the intraday charts I do have some concerns about a sharp sell-off in the very near future.
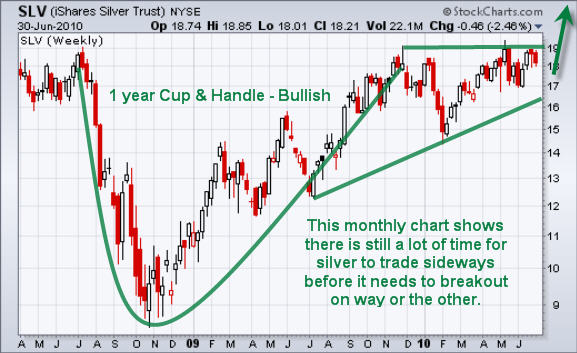
Silver ETF SLV – Weekly Chart
This is a weekly chart and goes all the way back to 2008 showing a very large cup & Handle. We could technically still see silver trade sideways for several months before it reaches the apex and is forced to breakout in either direction. The upside potential for a cup and handle pattern is 100- 300% of the height of the cup. So this means $1450 gold and $29 silver using the minimum potential.
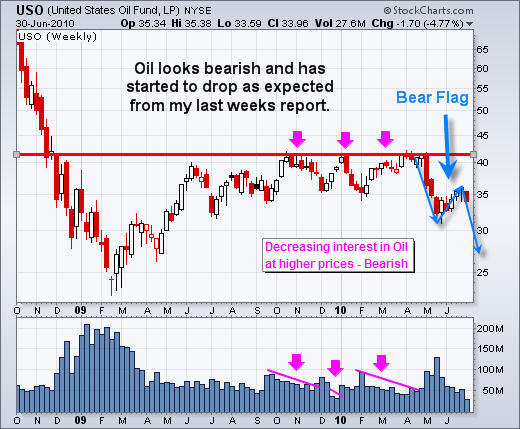
Crude Oil Fund – Weekly Chart
Oil formed a triple top over the past 10 months and has started to head south. We have seen selling volume drop during the test of resistance which is not a good thing.
SP500 ETF SPY – Weekly Chart
The SP500 along with several other indexes have formed a head & shoulders patter and appear to be in the process of breaking down through the necklines. If this unfolds then we are looking at much lower prices for stocks.
Get in touch if you have any questions 03 5724 5100
Ever Wonder…
Why the sun lightens our hair, but darkens our skin? Why is lemon juice made with artificial flavor, and dishwashing liquid made with real lemons? Why is the time of day with the slowest traffic called rush hour? Why is it that doctors call what they do “practice”? Why don’t sheep shrink when it rains? Why isn’t there mouse-flavored cat food? Why are they called apartments when they are all stuck together? If con is the opposite of pro, is Congress the opposite of progress? If flying is so safe, why do they call the airport the terminal?


