How far gold is off course?

Posted on 29th July 2013 by Trevor in Uncategorized

Frank Holmes of US Global Investors is another who has forgotten more about the gold market
than many will ever know.

Here is his take on how far gold is off course:
Gold has been in extremely oversold territory lately despite drivers for the metal remaining in place.
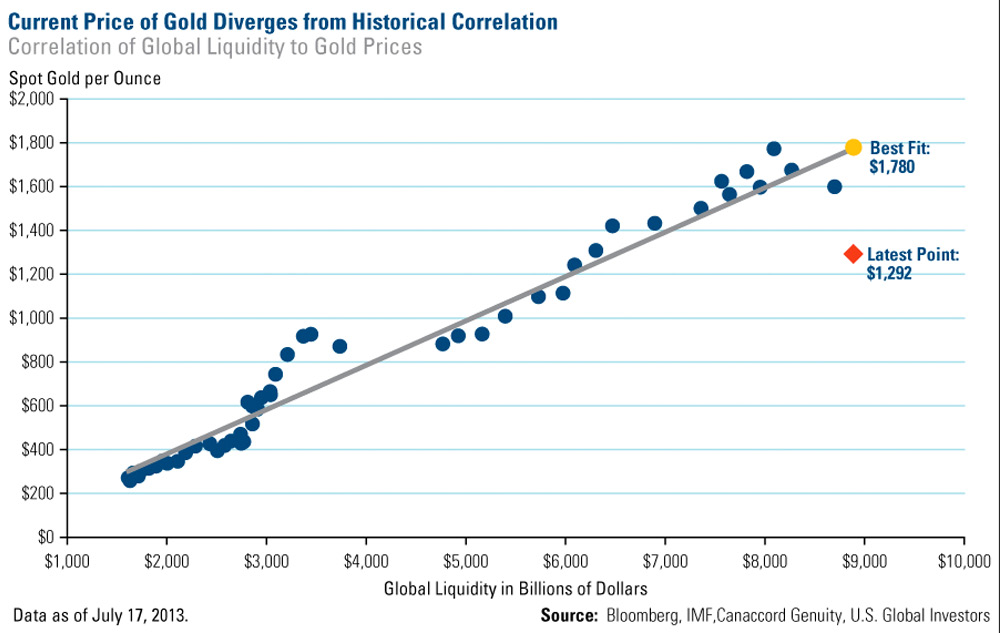
Here’s a different way to look at how far gold has been off course. The chart below tracks the correlation of the price of an ounce of gold to global liquidity, with global liquidity defined as the sum of the U.S. monetary base and the foreign holdings of U.S. Treasuries. Since June 2000, as the U.S.’s monetary base and foreign holdings increased, so did the price of gold.


The correlation suggests the current level of liquidity supports a gold price of $1,780 per ounce, well above the current spot price around $1,300.

Source: US Global Investors
Summer thoughts on the markets and gold

Posted on 24th July 2013 by Trevor in Blog |Finance in Focus

We see two possible economic scenarios that could unfold going forward.

Goldilocks Scenario 1: Good economic news continues to come in, the stock markets’ recent rally continues. Talk of a double-dip recession recedes, the U.S. economy begins to recover further. Even Europe starts to look better. Abenomics works and Japan starts to grow.

All looks great. The Federal Reserve’s efforts to save the U.S. economy and financial system succeed.

So what happens next under this, albeit the least likely, scenario? The banks start lending more money … credit flows through the pipelines … and the trillions of paper dollars the Federal Reserve has created begin to work their way through the system.  Normal credit creation fully resumes. So all the money created starts to be lent out and inflation begins to take hold in the USA and the rest of the world . . . Obviously, gold would soon bottom and start moving up again as it would be inflation and interest rate driven.  (Remember gold rose in the 70’s with rising rates)

Now consider …

Scenario 2 (most likely): More bad economic news starts to come in … the U.S. economy goes from OK to so-so and it becomes painfully clear that governments’ and central banks’ rescue efforts have yet to work.

In Europe and Japan economies slump further, and sovereign-debt defaults proceed across the globe.  The interesting thing here is money will very likely flow into the USA markets as fear comes across Europe and Japan.  Giving the illusion that the US is actually doing well — as it must be right, the US markets are going higher! You will see the US$ and gold rise at the same time. The US market will rise higher than many predict as it will be the last game in town.

The Fed and other central banks pump trillions more dollars into their economies. But to no avail, because it also becomes painfully clear to almost everyone that countries are BANKRUPT. And so are their central banks.

What happens under this scenario? All currencies dramatically lose purchasing power and the entire world plunges into a “greater” depression. The world’s monetary system is under huge pressure but, the sun still rises and life carries on.

Physical gold and gold shares will protect those who have them.

FYI another 3+ tonnes was removed Friday (19thJuly) from the Comex “eligible” bin. This time for HSBC’s eligible inventory. Total gold on the Comex is now down to 6.8 million ounces. Note that this is “reported” gold stocks, for which the CME now uses a disclaimer in reporting the numbers. The total amount of gold futures open interest is now 47 times more than the registered gold (available for delivery gold) on the Comex. Those who are savvy are buying a lot of gold and taking possession. You have to buy physical gold and  gold shares  and take possession of it or else you don’t own gold.The Bottom Line

The reason we have seen such a big sell off in gold:

  • that inflation expectations are currently in check due to China’s slowdown
  • at the same time the US’s industrial production is trending lower
  • Governments worldwide still have a massive debt overhang
  • deflationary forces are still acting on us


Medium to Long-term, with all the central banks printing full steam, gold will move higher. It is just a matter of time. So short term gold may still move lower, but in the medium to long-term we think you will see gold go a lot higher.  The real bull market in gold will only begin once we have passed the 1980 inflation adjusted high: our guess is this will start to happen in 2015~ 2018.

In either scenario gold will bottom soon (if not already) and head higher, for the simple reason that gold is insurance against a global economy that really has only two future scenarios right now, as laid out above.

Our advice would be to hold and continue buying gold and gold miners, as gold starts a path higher toward a minimum target of $2,300 an ounce, the inflation-adjusted high that would be equivalent to what $850 gold was in February 1980.

Investors all over the world are soon going to start loving gold, all over again. There will be shocks along the way:  we may not have seen the low in this cycle yet but, the downside is now at worst around $1,000 for gold while the upside is beyond $3,000.

Call us to discuss the differences in Gold ETFs and various mining shares and funds.

Do Western Central Banks Have Any Gold Left??? Part III

Posted on 18th July 2013 by Trevor in Blog |Uncategorized

This was all orchestrated to increase supply and tame demand. We believe that central planners are now running out of options to suppress the gold price. After taking a pause, the secular gold bull market is set to continue.


http://sprottglobal.com/markets-at-a-glance/maag-article/?id=8044